

How does Google make it’s money? By looking at Google’s fiances and earnings and income reports we can see exactly how Google makes money!
A lot of people wonder how a company that provides a service so simple as a search engine as been able to be so successful and make so much money.
Most people know that Google makes most of it’s money from online advertising but can that really add up to enough revenue to sustain one of the World’s largest companies? When you receive as much traffic as Google does, it absolutely does!
See Also: Global Internet Usage Statistics [Infographic]
An infographic (posted below) was recently published by BestAccountingSchools.net that presents us information regarding Google’s financials, income and earnings.
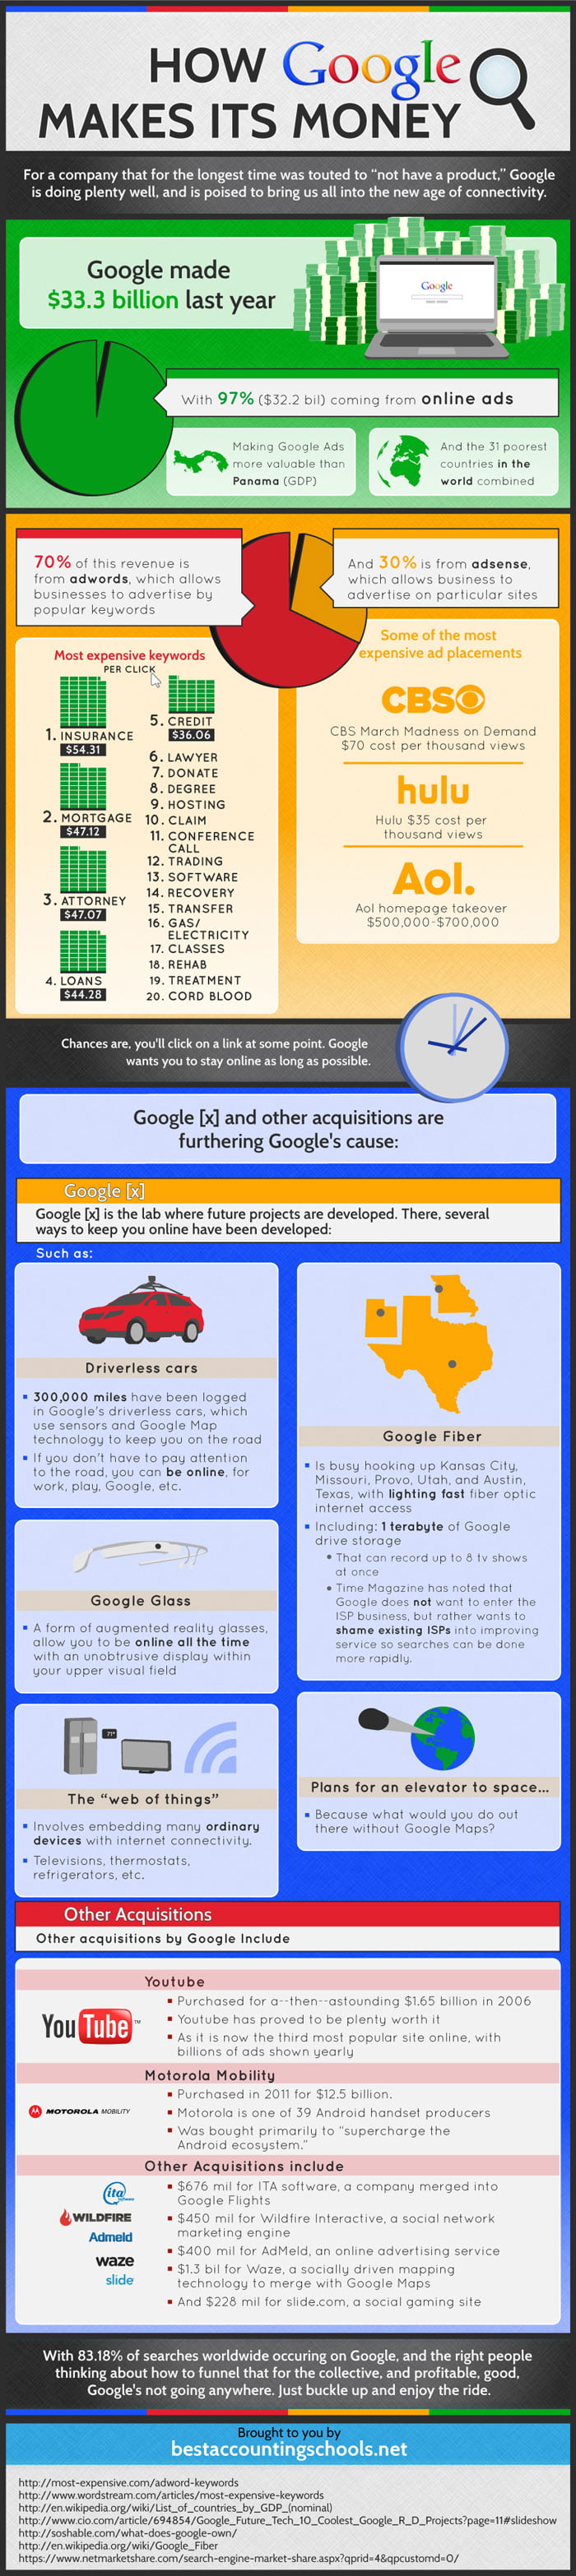
According to the infographic, 97% of Google’s annual income of $33.3 billion came from online advertising last year.
Google Financials Infographic Highlights:
- Google ads are worth more than the entire country of Panama.
- 70% of Google’s income is generated by AdWords.
- The 5 most expensive Google keywords to advertise for are:
- Insurance
- Mortgage
- Attorney
- Loans
- Credit
- 83.13% of online searches are performed using Google Search.
View more infographics from AnsonAlex.com.