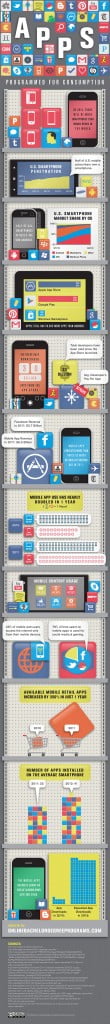
After taking a look at some mobile app usage statistics, it is quite evident that mobile app usage is higher than ever and there are no signs of the trends slowing down.
In a previous infographic on smartphone usage , it was noted that there are now over 1 billion smartphones worldwide and people are using them more and more often.
People are now spending more time using mobile apps than they are browsing the web on their computers.
An infographic (posted below) provides a number of interesting statistics regarding current mobile app usage and trends.
Mobile App Usage Statistics Infographic Highlights:
- The Apple App Store now has over 650,000 apps and the Google Play Store has over 600,000 apps.
- IOS users have downloaded over 30 billion apps from the Apple App Store.
- iPhone Developers have received over $5 billion since the launch of the App Store.
- The average IOS developer makes $7,629 per app.
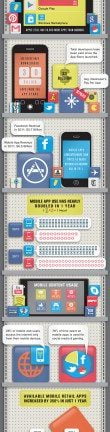
- Mobile app revenue amounted to $8.5 billion in 2011.
- From 2010 to 2011, mobile app use nearly doubled.
- The most common type of mobile apps used are email apps.
- 25% of mobile web users access the internet daily from their mobile phones. Editors note: I’m surprised this isn’t higher!
- 79% of the time spent using mobile apps is spent using social media and gaming apps.
- From 2010 to 2011, the number of mobile retail apps increased by 350%.
- In 2011, the average number of apps installed on each smartphone was 32. In 2012, that number has grown to 41.