
Online advertising statistics show that the digital advertising industry is continuing to grow but may taper off in coming years.
As more people are connected to the internet than ever before and younger generations are spending more time watching videos on the internet than on TV, advertisers are flocking to the internet in search of the best way to reach and convert their target audiences.
See Also: How Much Money are Cooperations Spending and Making on Social Media [Infographic]
An infographic (posted below) was recently published by the Invesp Blog that provides us with numerous statistics related to online advertisement growth, expenditures and primary display mediums in the United States.
A lot of people are skeptical about online advertising because internet users have more control over their online experience and can more easily ignore and move away from online display ads.
Conversely, online advertisers have the advantage of being able to entice an internet user to click through to their website and possibly make a purchase more easily then a television viewer can do.
Take a look at the interest advertising statistics below and let me know what you think!
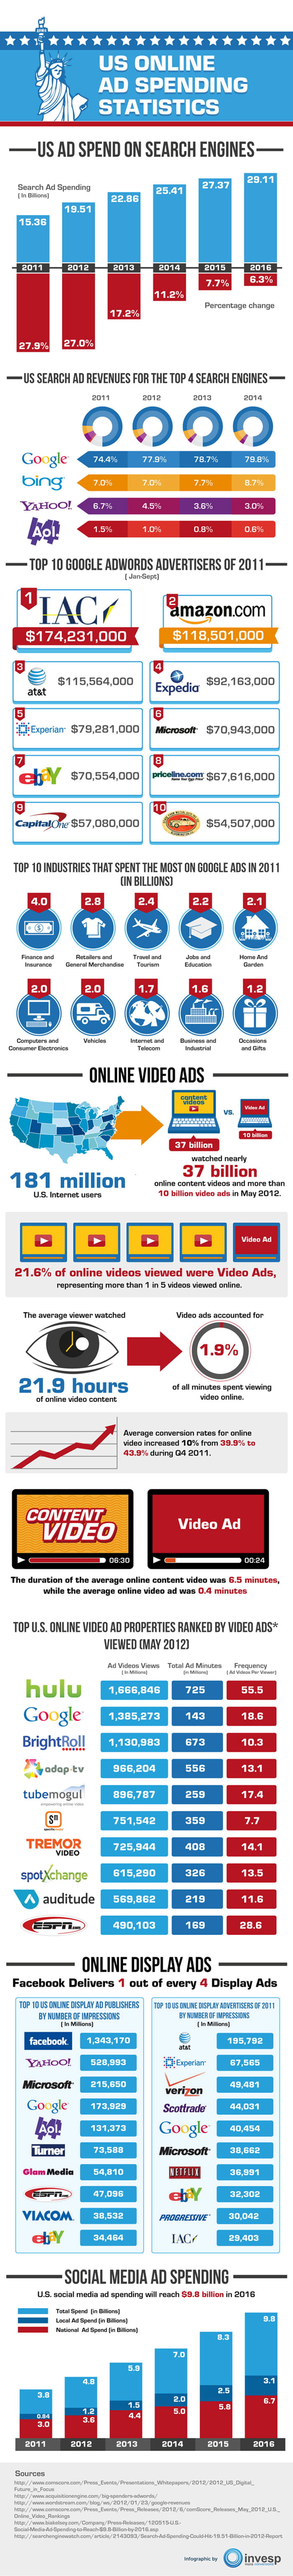
Online Advertising Statistics (U.S.) Infographic Highlights:
- Online advertising grew by 28% in 2011, 27% so far in 2012 and is expected to grow by 17% in 2013 and 11% in 2014.
- Over $19 billion is expected to be spent in online advertising by the end of 2012, compares to only $15 billion in 2011.
- Ad revenues are expected to make up 78% of Google’s revenue in 2012.
-
The top 5 Google AdWords advertisers in 2011 were:
- IAC/Interactive Corp ($174,231,000)
- Amazon.com ($118,501,000)
- AT&T ($115,564,000)
- Expedia ($92,163,000)
- Experian Group ($79,281,000)
-
The top 5 industries in online advertising expenditures in 2011 were:
- Finance and Insurance ($4 billion)
- Retailers and General Merchandise ($2.8 billion)
- Travel and Tourism ($2.4 billion)
- Jobs & Education ($2.2 billion)
- Home & Garden ($2.1 billion)
- Over 21$ of online videos viewed in May of 2012 were advertisements.
- 25% of all displayed ads delivered on the internet is delivered via Facebook.
- Social media advertising is expected to grow from $3 billion in 2011 to $3.6 billion in 2012, $4.4 billion in 2013 and $5 billion by 2014.