
As the online population continues to grow, it becomes increasingly important to look at internet growth statistics in regards to who is using the internet and what they’re using it for.
With amount of time that people are spending on the interent every single day, marketers and retailers realize that there is an immense amount of potential to make money and sell products via the internet.
See Also: Social Media Usage Statistics 2012 [Infographic]
Because interent users have almost complete freedom in regards to which sites they visit and interact with, it is necessary for businesses and marketers to look at online population growth trends and usage statistics to find the best digital medium to reach their desired target market.
An infographic (posted below) was recently published by CustomerMagnetism.com that gives us a great idea of just how fast the interent is growing and which aspects of the interent are the most popular.
Online Population Growth Statistics Infographic Highlights:
- Search engine usage, online shopping activities and online news usage have all increased since 2002. Email usage has slightly decreased.
- The internet, in terms of internet users, has grown 528.1% since 2000.
- 32.7% of the World’s population is on the internet (2.27 billion people).
- Google now has over 66% of search engine market share.
- 20% of the daily searches on Google have never been searched before.
- Online 15% of companies were participating in social media marketing in 2009. As of 2012, that number has risen to 88%.
- That average interent users spends 30% of their leisure time on the internet each and every day.
- The average internet usage spends 30 minutes of watching videos online per day.
- 90% of all purchases are influenced by social media.
- 50% of online mobile traffic comes from social media.
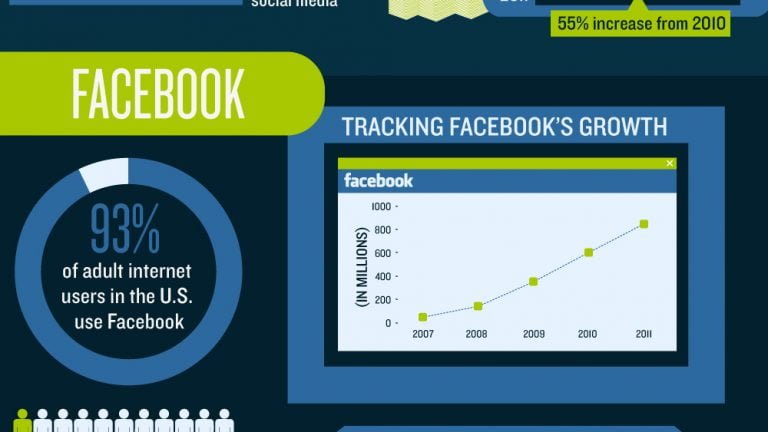
- The amount of money spent advertising on social media rose 55% from 2010 to 2011 ending up at $3.08 billion.
- 93% of adult internet users in the U.S. use Facebook.
- From 2010 to 2011 the average number of tweets per day rose from 35 million to 200 million.
- Online sales is expected to grow by 10% each year for the next 5 years.