Solar power efficiency has been steadily increasing and solar power will be efficient enough and cheap enough to be a substitute for many traditional forms of energy in the near future.
See also: Tablet and iPad Efficiency and Consumption [Infographic]
The main reason that solar energy has not already become the primary energy source for humans is because, traditionally, we have only been able to harness 10% or less of the amount of energy in a single square foot of sunlight hitting the Earth’s surface.
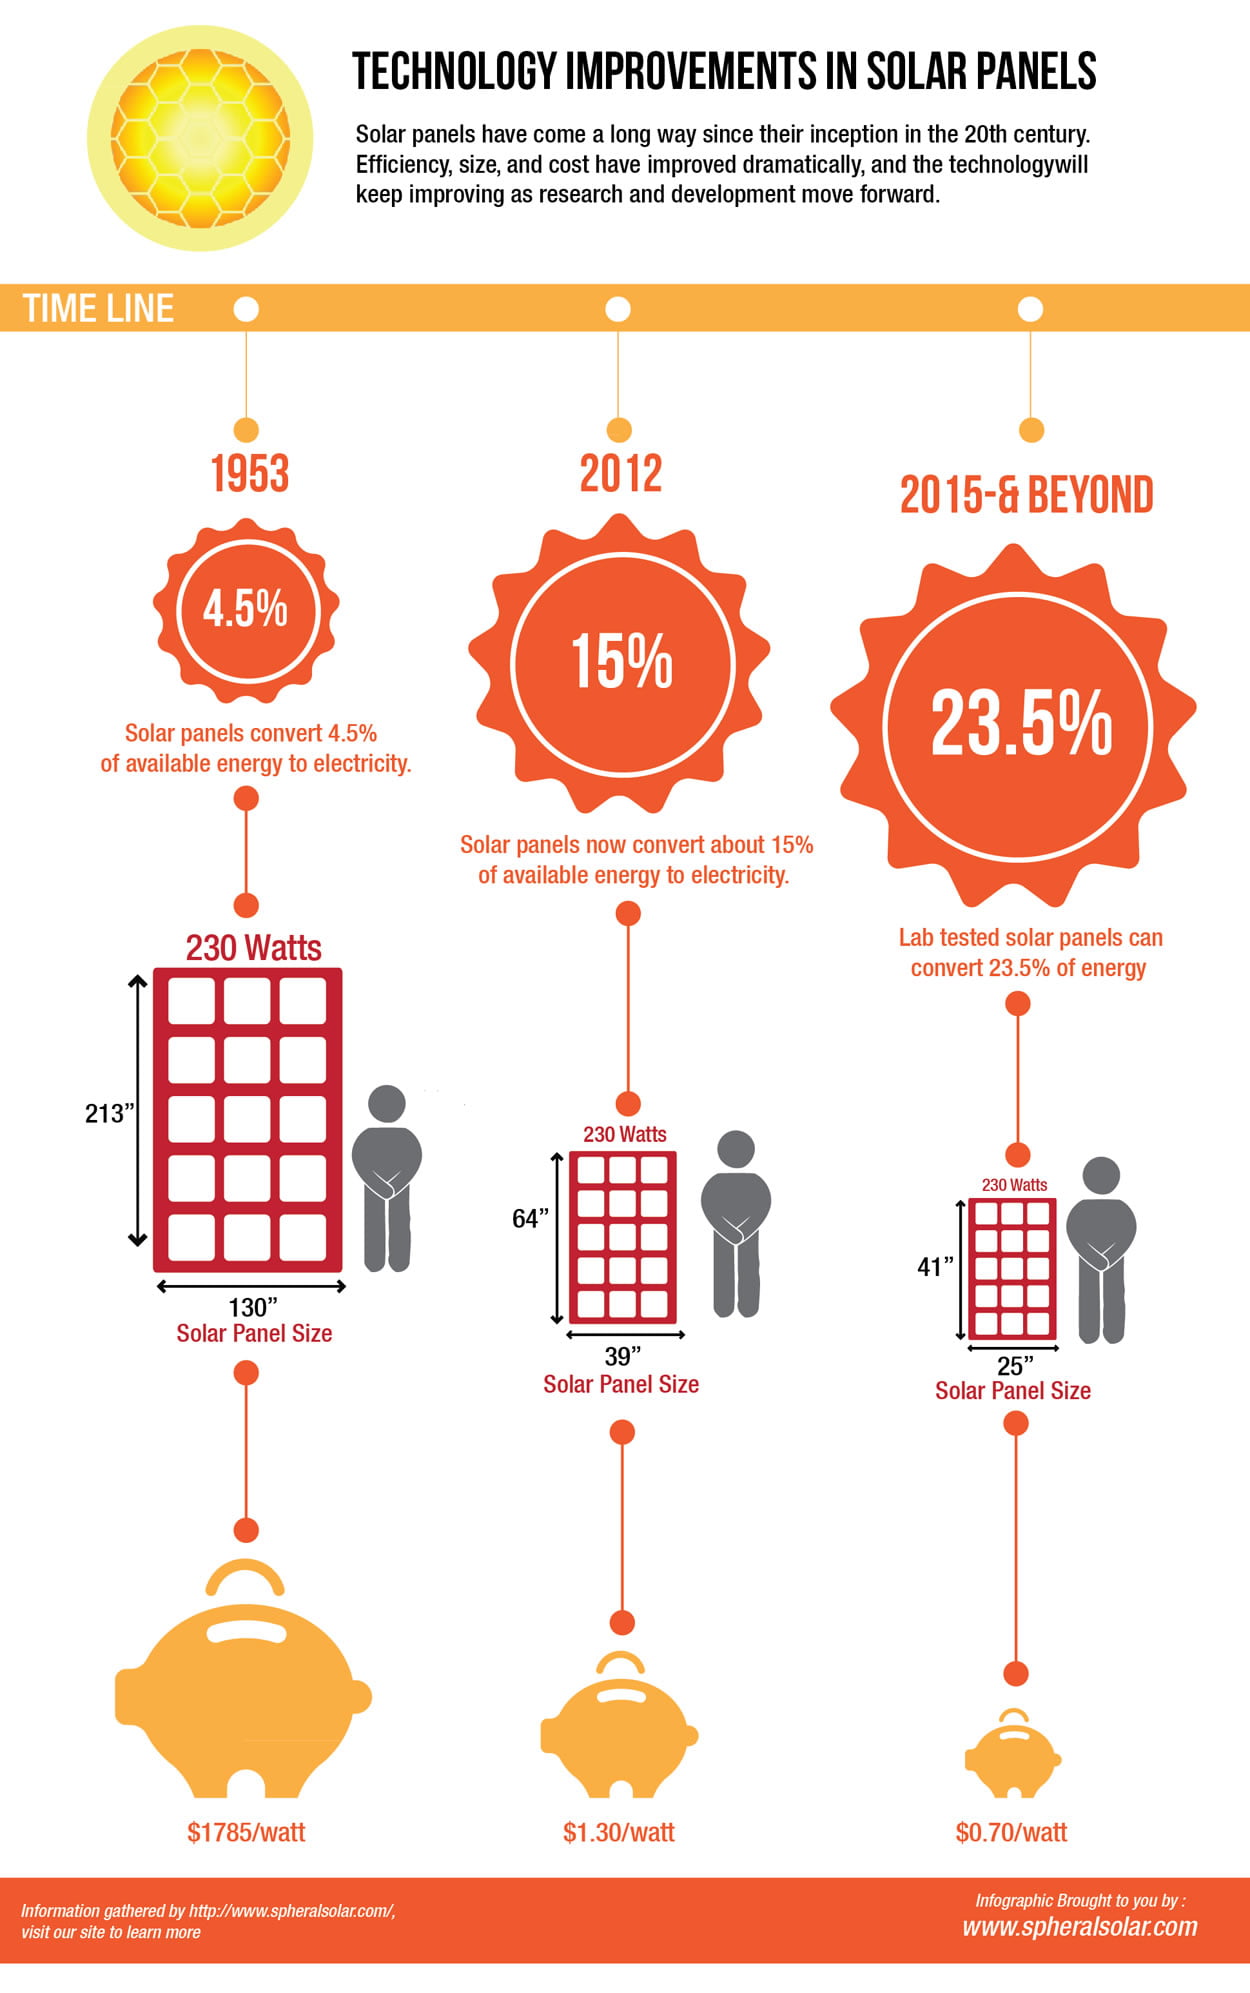
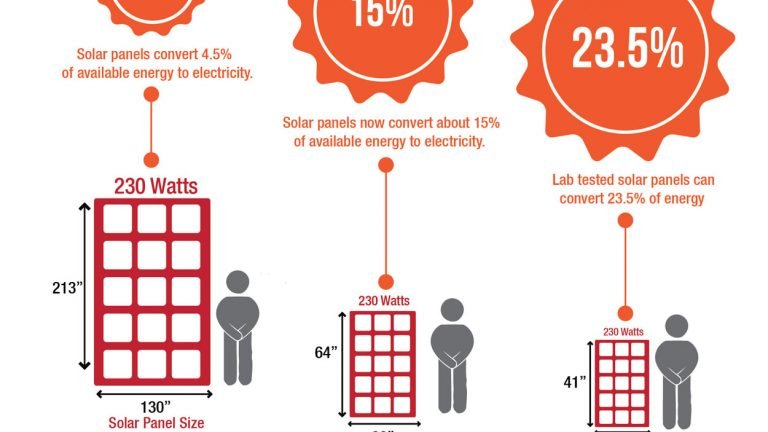
A chart (posted below) was recently published by SpheralSolar.com that presents us with the evolution of solar power efficiency since 1953, how efficient solar power is in 2012 and how efficient solar power will be in 2015 and beyond.
It is quite astounding how quickly our ability to harness energy from the sun is increasing!
Solar Power Efficiency Evolution:
-
1953
- Solar panels convert 4.5% of available energy to electricity.
- Solar energy costs $1750 per watt.
-
2012
- Solar panels convert 15% of available energy to electricity.
- Solar energy costs $1.30 per watt.
-
2015
- Solar panels convert 23.5% of available energy to electricity.
- Solar energy costs $0.70 per watt.