Online internet scams are on the rise and there are plenty of statistics to prove it.
As we browse the internet on a daily basis, it seems to have come a long way in terms of safety and security since its early days.
In reality though, internet scammers have just become more subtle and tricky than before and it is just as important to watch out for scams and fraud over the internet as it has ever been.
See Also: iPhone and Android Security Issues 2012 [Infographic]
An infographic (posted below) was recently published by BackgroundCheck.org that provides us with a great deal of statistics related to internet scams and fraud.
Internet Scam Statistics Infographic Highlights:
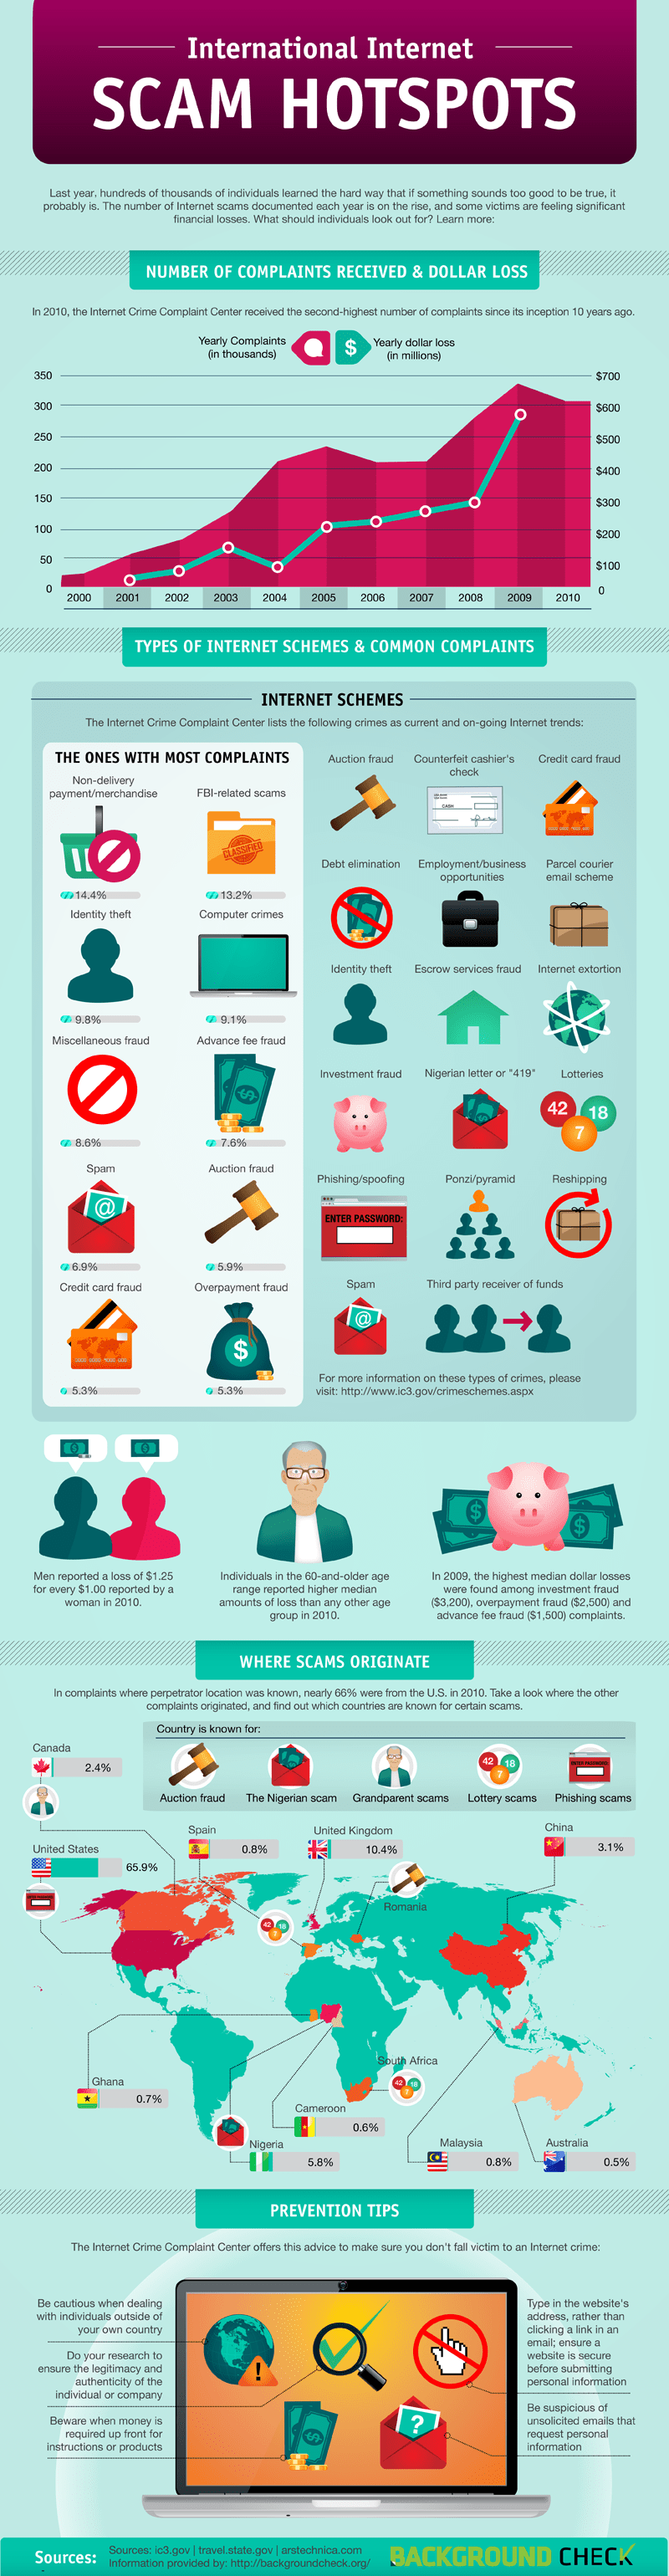
- From 2005 to 2009, internet scam complaints rose from 100,000 per year to nearly 300,000 per year.
- The monetary loss of scam complaints easily exceeds $300 million per year.
-
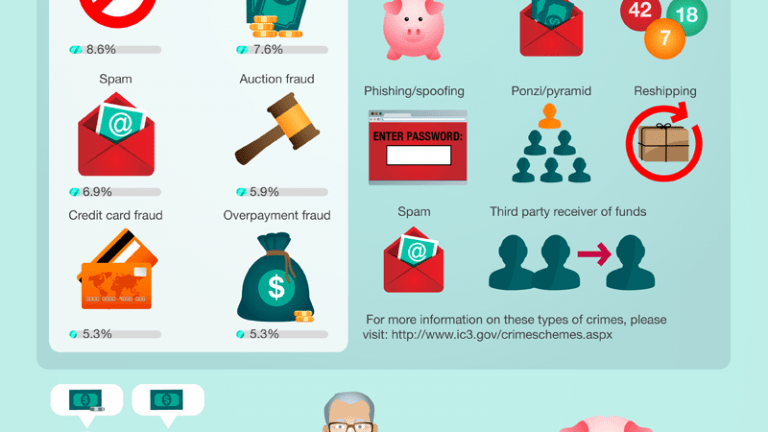
Top 5 internet scams with the most complaints:
- 14.4% – Identity theft
- 13.2% – FBI-related scams
- 9.8% – Miscellaneous fraud
- 9.1% – Advance fee fraud
- 8.6% – Spam
- Men report 25% higher monetary losses related to internet spam than females.
- In 2010, individuals in the 60 years or older group reported higher amounts of monetary loss from internet scams than any other group.
-
The 3 most commons locations for internet scams to originate are:
- 65.9% – United States
- 10.4% – United Kingdom
- 3.1% – China