Trends and statistics show that smartphone usage will continue to rise in years to come.
Satellite driven smartphones have begun to penetrate rural areas and markets that, traditionally, would not even have dial-up access to the internet.
Last year, I posted an infographic on smartphone usage and it was one of my most popular infographics of the year.
This year, I would like to share a similar infographic (posted below) originally published by Compendium, the Marketing Tech Blog and Exact Target.
The infographic presents us with a slew of information regarding how people are using smartphones, where they’re using smartphones and how smartphone usage trends are increasing.
Smartphone Usage Infographic Highlights:
- By 2016, 80% of the US population will use mobile phones.
- By 2016, 50% of the US will use iPads / tablets.
- 97% of 18-29 year olds use smartphones to send text messages.
- By November 2012, over 20% of all blog visits came from a mobile device or tablet.
- Smartphone users are less likely to click on a link in a newsletter than computer users.
- Most common activities by smartphone users:
- SMS / text messaging – 90%
- Maps – 72%
- Surfing while traveling – 70%
- Surfing while in a restaurant – 64%
- While in a store – 63%
- Most common activities by tablet users:
- Web browsing – 88%
- Email – 84%
- Playing games – 72%
- Watching videos – 52%
- Mobile and smartphone usage is most prevalent in the morning and evening.
- Smartphone users tend to glance at and skim over emails more than desktop users who tend to fully read emails.
- Smartphone users around the world tend to use their smartphones at home more than anywhere else.
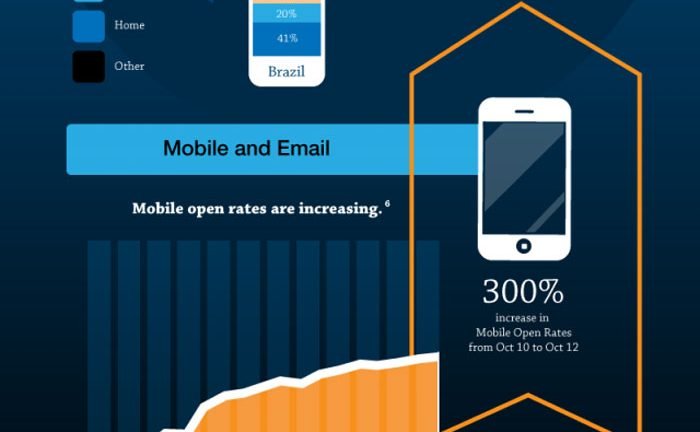
- From October 2010 to October 2012, email open rates on smartphones increased by 300%.
- Mobile email creates twice as many conversions as social and search.
- The average price of an order placed from a mobile device is higher than the average order from a tablet or desktop.
- Mobile and smartphone usage is higher Thursday – Monday than on Tuesday or Wednesday.


