Apple Inc. (AAPL) is one of the most interesting tech companies to monitor in regards to sales statistics – specifically iPhone and iPad sales statistics.
Apple has an abundance of cash and, based on recent trends, it seems that they are only improving their position as one of the World’s largest producers of personal phones, computers and devices.
See Also: How Much Money Did Google Make in 2011? [Infographic]
An infographic (posted below) was recently published by sortable.com that provides us with a ton of information regarding Apple sales statistics, sales trends, company information and market share statistics for both the iPhone and the iPad in 2012.
Highlights of the Apple Sales Statistics 2012 Infographic:
- Over the last 12 months, Apple has revenues of over $142 billion.
- Apple profits rose 94% last quarter.
- For every $1 a consumer spends on Apple products, Apple makes $0.47.
- Apple has surpassed WallStreet’s revenue estimates in 16 of the last 17 quarters.
- Apple has $110.2 billion in cash.
- Apple could buy RIM ($13.59 billion), Nokia ($6.85 billion), Twitter ($8 billion), Adobe ($16 billion), Netflix ($4.6 billion) and TMobile ($39 billion) and still have extra cash to pay out in dividends.
- Since the release of the first iPad, Apple Inc’s stock (AAPL) has skyrocketed.
- 75% of Apple’s revenue comes from the iPhone and iPad.
- The iPhone is available in 100 countries and through 230 wireless carriers.
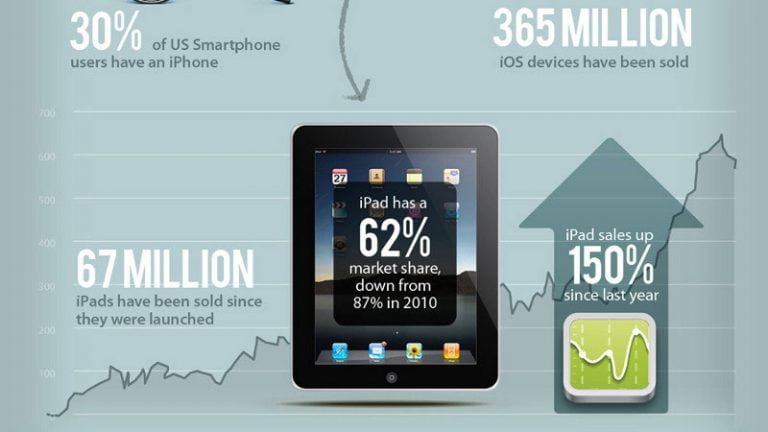
- 30% of U.S. smartphone users own an iPhone.
- 365 million iOS devices have been sold.
- 67 million iPads have been sold.
- The iPad has a 62% market share (87% in 2010).
- iPad sales have risen 150% since last year.
- There are 600,000 apps available in the Apple App Store (18% games).
- 47% of apps available in the App Store are free.
- Apple Inc. has more than 30,000 employees.
- Over 18,000 consumers visit Apple Stores every week.
- Apple Stores average $50 million in sales each.
- Apple makes $6,116 per square foot of store space.
- China accounts for 20% of Apple’s sales ($7.9 billion).


