Pinterest has shocked the social media world by growing to one of the most popular social sharing platforms in a very short period of time.
In order to understand how Pinterest has been able to attract so much attention, it helps to take a look at the usage statistics of Pinterest and identify who Pinterest’s users are, what they’re using the service for and how often they’re using Pinterest.
See Also: Social Media Usage Statistics 2012 [Infographic]
Recently, an infographic (posted below) was recently published by The Huffington Post that provides us with a slew of user statistics regarding Pinterest.
Pinterst Usage Statistics Infographic Highlights:
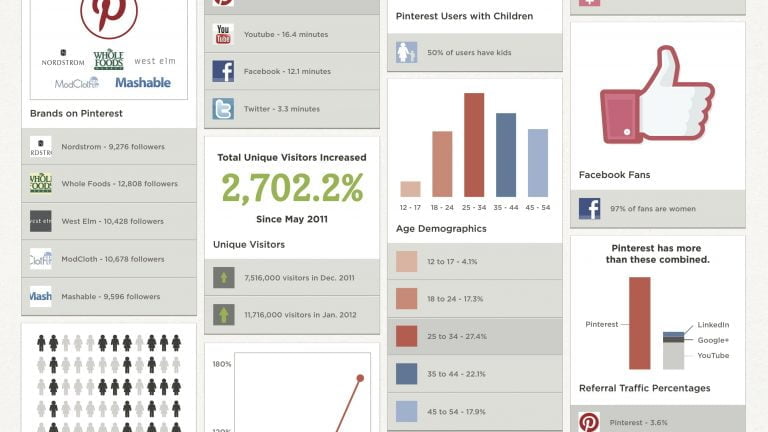
- Pinterest users spend an average of almost 16 minutes on the site per visit (12.1 for Facebook).
- 50% of Pinterest users have children.
- Almost 70% of Pinterest users are female.
- 97% of Pinterest’s Facebook fans are women.
- As of January 2012, Pinterest had received just under 12 million unique visits.
- Pinterest receives almost 1.5 million visitors each day.
- Pinterest provides more referral traffic to other sites than Google+, YouTube and LinkedIn combined.