Some of you may remember the first infographic I posted that compares Google+ to Facebook. I’ve found another one, originally posted by SingleGrain.com, that I belive is even better than the first.
This infographic contains more statistical information than the first Google+ vs. Facebook infograhpic I published. Google+ has also been out long enough now to make more accurate comparisons to Facebook.
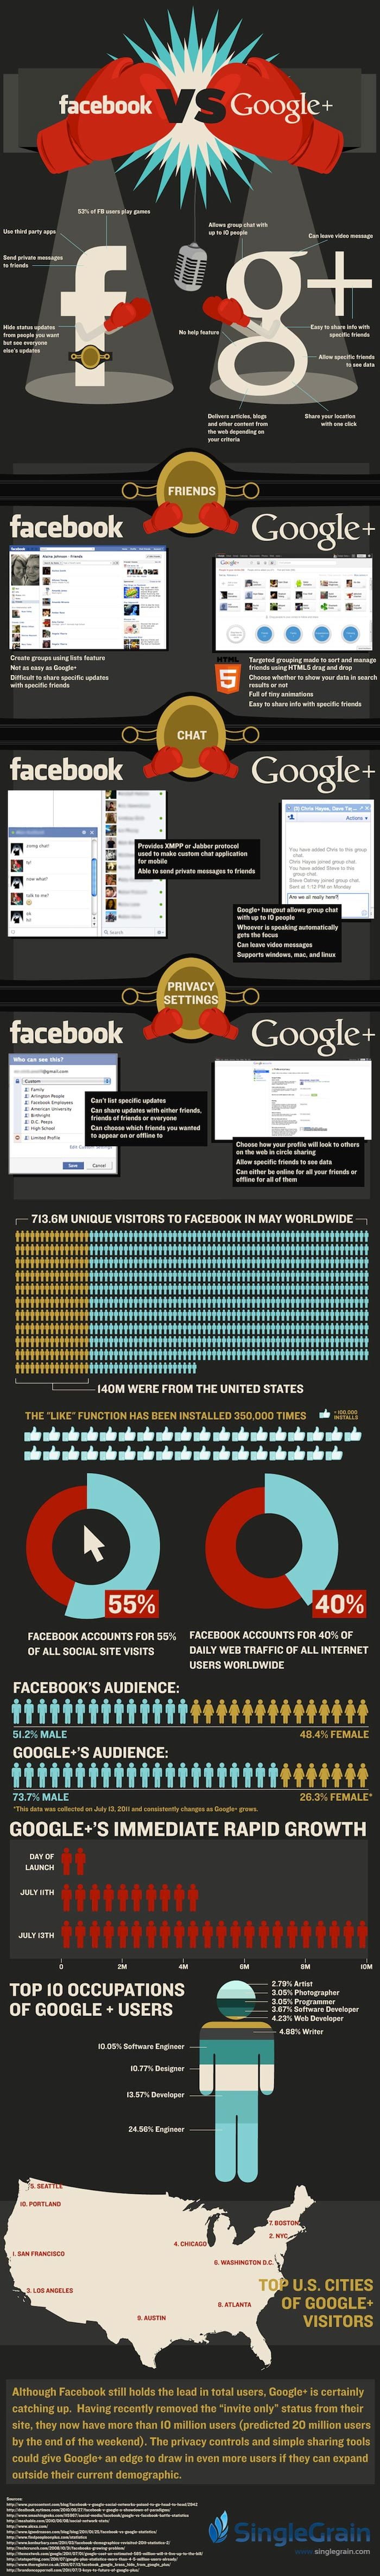
Here are some of the highlights of this infographic:
- Facebook accounts for 40% of daily web traffic of all internet users worldwide.
- Facebook has almost a 50/50 ratio in terms of male and female. Almost 74% of current Google+ users are male.
- 53% of Facebook users play games. Google+ doesn’t offer games- yet.
- Facebook accounts for more than 50% of visits to any social media platform.
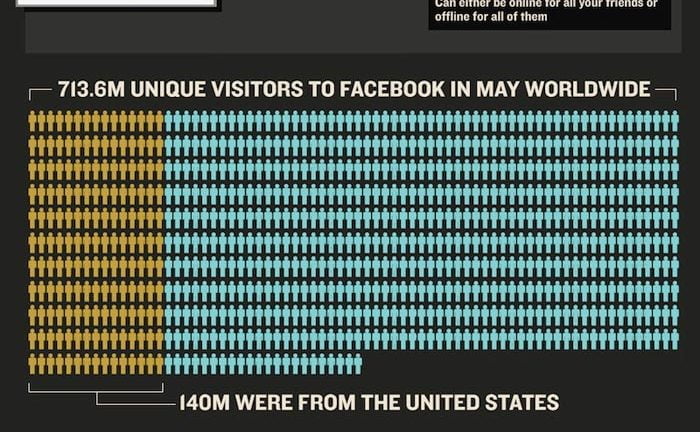
- 20% of Facebook users are located in the United States.
Obviously both companies will continue to innovate their social platforms and I will post updated information as soon as I become aware!
Let me know what your thoughts are in the comments section and don’t forget to check out some of my other awesome infographics before you leave!
[pinit]