The mobile video game market is often overlooked when discussing the exponential increase in mobile device usage in the 21st century.
In fact, if you look at the statistics related to mobile gaming, you will notice that it is one of the most popular activities performed on smartphones.
See Also: Smartphone Usage Statistics 2012 [Infographic]
Remember the days when video games were only for kids and had to be played on a console at home? Those days are long past!
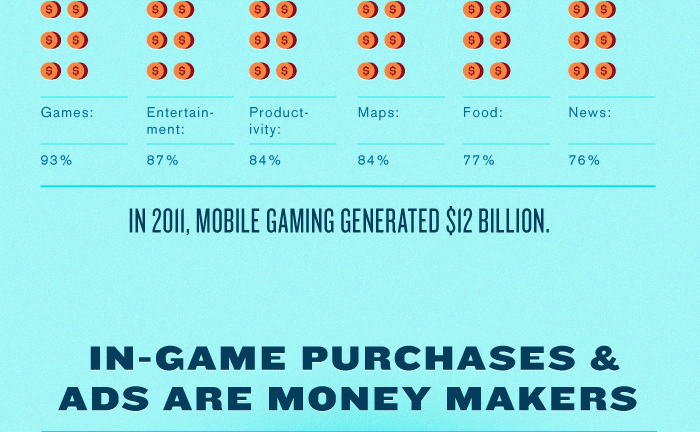
An infographic (posted below) was recently published by BusinessDegree.net that provides us with a slew of statistics related to mobile gaming usage and the profitability of the mobile video game industry.
Mobile Video Game Statistics 2012 Infographic Highlights:
- 64% of mobile users play games daily – a higher percentage than social media, news and music.
- iPhone users spend the most time playing games – 14.7 hours per month.
- The most popular place to play mobile games is in bed.
- 52% of mobile gamers play for more than 1 hour per day.
- In the United States there are over 100 million mobile game players.
- In 2011, mobile gaming generated $12 billion.
- 34% of the top 100 grossing mobile games use a “freemium” model – game is free to play but users can purchase in-game upgrades.
- Freemium games make an average of $12.92 per month per user.
- The popular Angry Birds game makes $6 million per month from display ads.
- Zynga’s games as a whole have 48 million daily active users.
- Zynga’s mobile gaming division brings in annual revenues of over $10 billion.


