2012 has arrived and the statistics show that smartphone usage and data consumption is only on the rise.
Although I’ve posted an infographic on text messaging statistics, I’ve never posted one containing statistics on smartphone usage in general.
See Also: Smartphone Usage Statistics and Trends 2013 [Infographic]
Fortunately, Go-Gulf.com recently published an infographic containing worldwide smartphone usage statistics such as, which smartphone has the largest market share, how many total smartphone users there are in the World and which smartphone users consume the most data.
Although the infographic is posted below, here are the some of the highlights:
- 80% of humans own a mobile phone (external source).
- There are 91.4 million smartphones in the United States alone.
- Out of the 5 billion mobile phones in the world, 1.08 billion are smartphones.
- Android has the highest market share with 46.9% – the iPhone has 28.7%.
- 9 out of 10 smartphone users use their phone on a daily basis.
- The most popular smartphone activity is texting, followed by internet browsing and playing games.
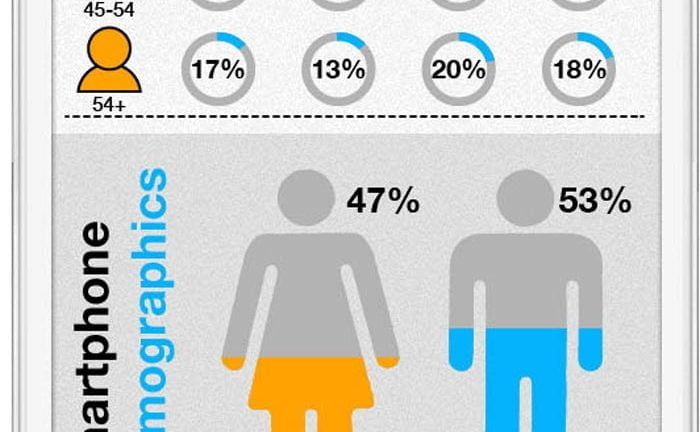
- A higher percentage of Android users are below the age of 34 in comparison to iPhone users.
- People between the ages of 25 and 34 are more likely to own a smartphone (62%) than any other age group.
- Android users consume the more data on a monthly basis (582MB) compared to users of other mobile operating systems.
- iPhone users download more apps on a monthly basis (48) when compared to users of other mobile operating systems.
- The top 10 countries in terms of smartphone penetration are:
- Singapore – 54%
- Canada – 39%
- Hong Kong – 35%
- Sweden – 35%
- Spain – 35%
- USA – 35%
- Australia – 33%
- Norwary – 33%
- New Zealand – 32%
- Denmark – 31%


