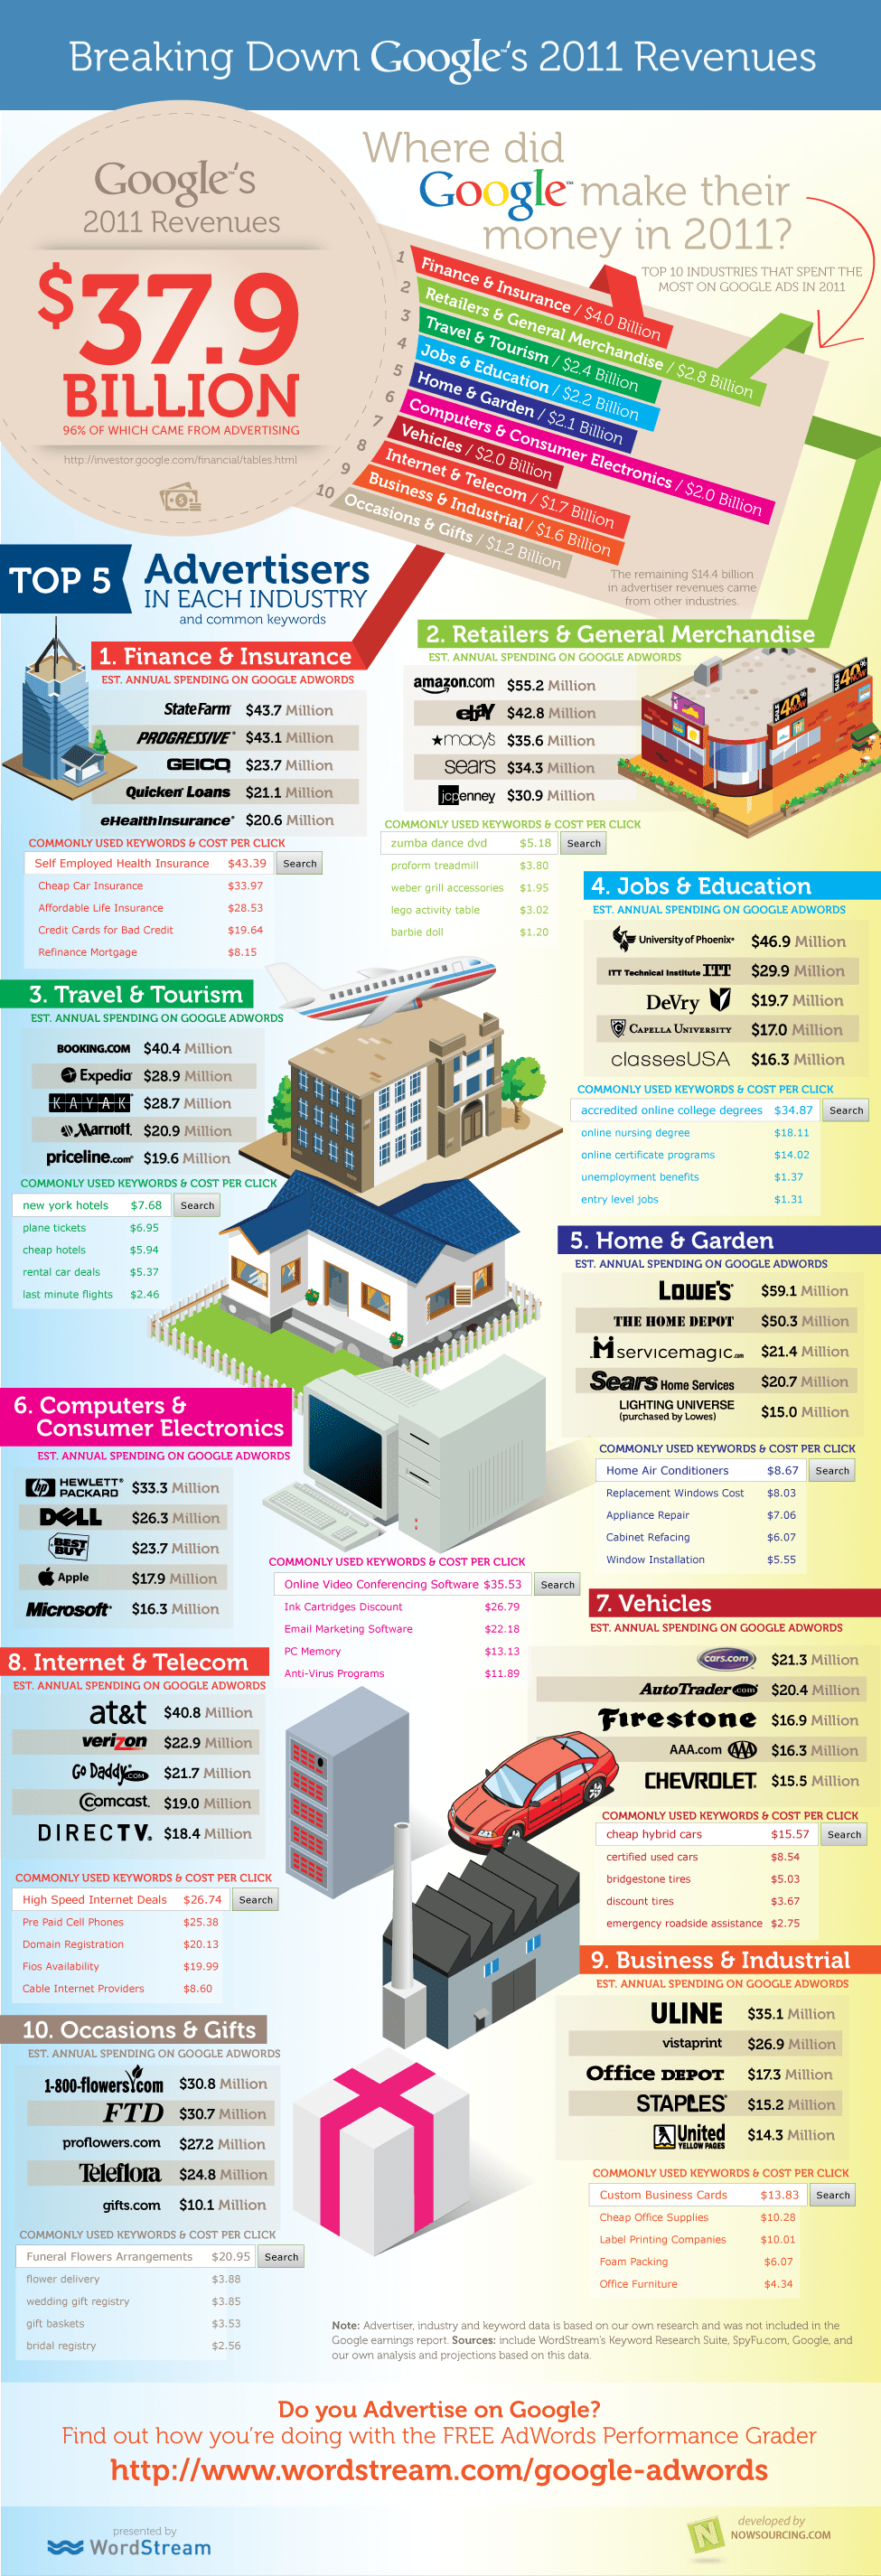
Knowing how much money Google makes can give us a very informative perspective of the internet’s economy, online advertising expenditures and insight into the financial direction the web is headed in.
Fortunately an infographic (posted below) was recently published by the WordStream Blog. The infographic does a great job of breaking down Google’s Revenue into 10 different industries.
It also shows the top companies in within each industry in terms of advertising money spent on Google Adwords. The most popular search keywords for each particular industry are also presented in the Google Revenue breakdown infographic.
In total, Google made $37.9 billion in revenue in 2011. 96% of that revenue was from advertising dollars.
After taking a look at this infographic, you may also be interested to find out what the anticipated Facebook IPO price projection is.
Top 5 Industries by Revenue for Google in 2011:
- Finance & Insurance – $4.0 billion
- StateFarm ($43.7 million)
- Progressive ($43.1 million)
- Geico ($23.7 million)
- Quicken Loans ($21.1 million)
- eHealthInsurance ($20.6 million)
- Retailers & General Merchandise – $2.8 billion
- Amazon.com ($55.2 million)
- Ebay ($42.8 million)
- Macys ($35.6 million)
- Sears ($34.3 million)
- JCPenny ($30.9 million)
- Travel & Tourism – $2.4 billion
- Booking.com ($40.4 million)
- Expedia ($28.9 million)
- Kayak ($28.7 million)
- Marriot ($20.9 million)
- PriceLine.com ($19.6 million)
- Jobs & Education – $2.2 billion
- University of Phoenix ($46.9 million)
- ITT Technical Institute ($29.9 million)
- DeVry ($19.7 million)
- Capella University ($17 million)
- ClassesUSA ($16.3 million)
- Home & Garden – $2.1 billion
- Lowe’s ($59.1 million)
- The Home Depot ($50.3 million)
- ServiceMagic.com ($21.4 million)
- Sears ($20.7 million)
- LightingUniverse ($15 million)


