
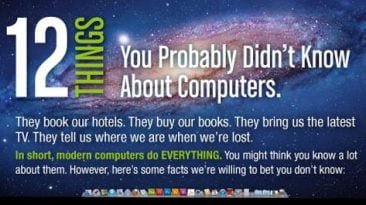
12 interesting computer facts related to computer use, history and technical specifications.
Infographics and charts with statistics related to technology and internet usage.
12 interesting computer facts related to computer use, history and technical specifications.
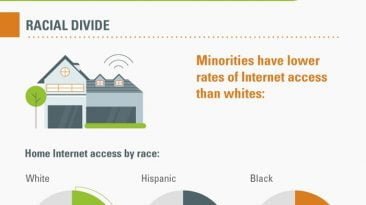
An infographic containing statistics on the digital and internet divide in 2012. Specifically, information on internet access rates, broadband...
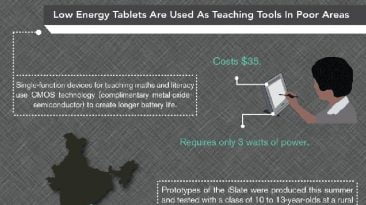
Tablet and iPad energy usage and consumption information in this inforgraphic is compared to the energy efficiency of similar devices.
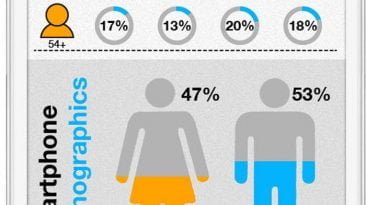
This is an infographic containing worldwide smartphone usage statistics as of 2012 such as, which smartphone has the largest market share, how many...
This infographic presents an industry breakdown of how much money Google made in term of revenue in 2011.
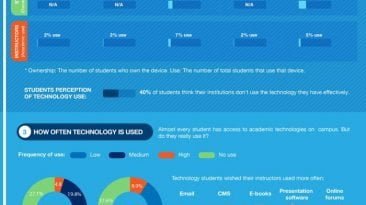
An infographic providing statistical data regarding the relationship between technology, university students and education in the 21st century.
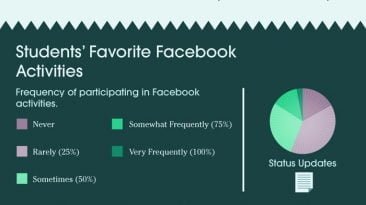
As Facebook becomes more and more widespread the debate on whether it is beneficial or harmful to students' grades - specifically those of college...
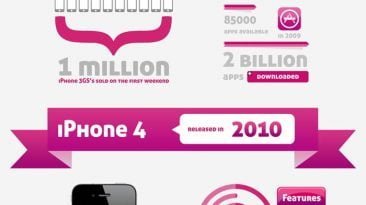
A timeline of the iPhone's evolution presenting information regarding the evolution of the iPhone, the technologies used to create the iPhone, the...
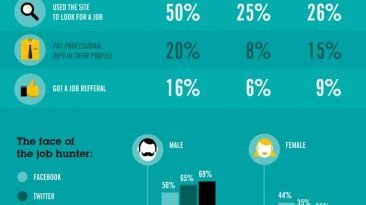
Social media has become a very useful tool in searching for jobs in the 21st century. This infographic explains how many people are using it, how are...

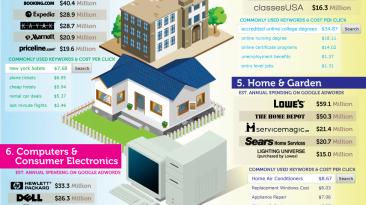
Google search has become a way of life for many people in the 21st century. If you're going to spend that much time searching Google, why not make...