There is no doubt that an intense mobile operating system war is being fought between Apple and Google. The die hard Apple fans are touting their iPhones whilst the rebel tech enthusiasts are flashing their Android-run mobile devices.
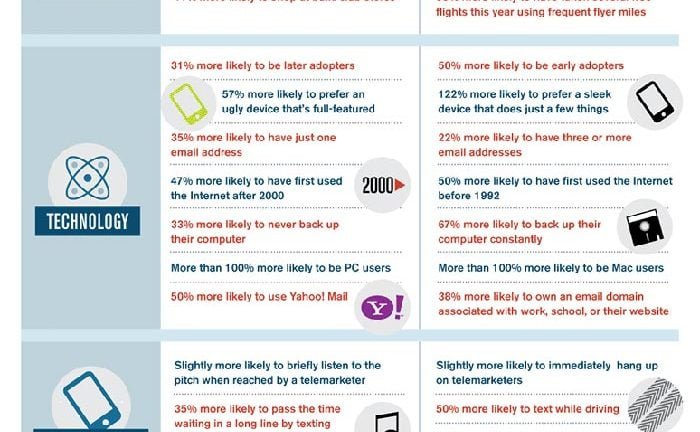
Okay, so it may be hard to draw demographic lines between iPhone users and Android users but an infographic (posted below) published by The Hunch Blog and based on a study of iPhone users and Android users, gives us a bird’s eye view at the social, economic and political differences between the two user groups.
The infographic really reminds me of another interesting infographic that I posted presenting the demographic differences between PC and Mac users. There are many similarities that arise between the two studies.
Infographic Highlights:
- Android users are 10% more likely to be men, iPhone users are 18% more likely to be women.
- Android users are 86% more likely to live in the country, iPhone users are 27% more likely to live in a city.
- Android users are 20% more likely to be politically conservative, iPhone users are 17% more likely to be liberal.
- Android users are more likely to be middle-class, iPhone users are more likely to be upper middle-class.
- Android users are 12% more likely to be introverts, iPhone users are 14% more likely to be extroverts.
- Android users are 29% more likely to save money, iPhone users are 26% more likely to spend it.
- Android users have a higher tendency to be followers, iPhone users consider themselves leaders.
- Android users are 71% more likely to have never left their country, iPhone users are 50% more likely to have been to over 5 countries.
- Android users are 12% more likely to have pets, iPhone users are 15% more likely to have traveled in the last 6 months.
- Android users are 31% more likely to be late adopters, iPhone users are 50% more likely to be early adopters.
- Android users are more than 100% more likely to be Windows users, iPhone users are 100% more likely to be Mac users – go figure!


