Submitting customer service inquiries via social media has become increasingly popular for internet savvy consumers.
Statistics related to social media customer service however, show that many companies fail to respond to or meet customer expectations of requests and complaints submitted via social media.
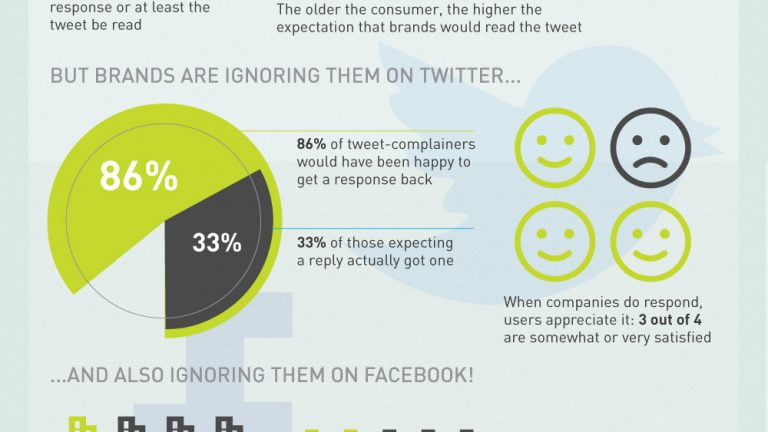
An infographic (posted below) presents a number of social media customer service related statistics.
After taking a look at the statistics, it is evident that many customers expect to receive feedback on their social media submitted inquiries but, often times, their requests are ignored and even deleted.
Social Media Customer Service Statistics Highlights:
- 93% of U.S. companies with 100 employees or more use social media for marketing purposes.
- 83% of U.S. companies, with 100 employees or more use Facebook, 53% use Twitter and 36% use YouTube.
- 50% of consumers that have complained to a company via Twitter, expect a response.
- Older consumers are more likely to expect customer services responses via social media than younger consumers.
- 86% of consumers that complained via a tweet would have been happy with a tweeted response.
- Only 33% of consumers expecting a customer service reply via social media actually received one.
- When companies do respond to social media submitted complains, 75% of complainers are satisfied or somewhat satisfied with the response.
- 25% of the top retailers have never responded to a customer message on their Facebook Page wall.
- 40% of retailers have actually deleted messages posted by customers to their Facebook wall.
- 80% of consumers feel that social media will continue to become the most popular medium to submit and address customer service related inquiries.
- Only 58% of U.S. marketers think that customer engagement improves their brand’s image.
- 56% of U.S. marketers feel that social media improves their customer loyalty.


