
This Wireshark tutorial for beginners shows you how to capture packets, filter out noise, and quickly understand what’s happening on your network on Mac or Windows—without the confusing, meaningless theory.
In other words, you’ll learn what to click, what it means, and what to look for when something feels slow, broken, or suspicious.
Important: Only capture traffic on networks and devices you own or have permission to analyze. Packet captures can contain sensitive data, so store PCAP files carefully.
Helpful next steps: If you don’t know your local IP yet, check your network settings first. You can also bookmark your main troubleshooting guide for later.
What you’ll learn in this Wireshark tutorial for beginners
- How to install Wireshark (Mac + Windows)
- Which network interface to capture from (Ethernet vs Wi-Fi)
- How to capture a clean PCAP you can actually learn from
- The fastest way to get a bird’s-eye view using Statistics → Conversations
- Beginner Wireshark filters (HTTP, HTTPS/443, flagged packets, resets, SYN packets)
- How to use Follow Stream to see what was exchanged
- How coloring rules help you spot potential issues faster
Wireshark tutorial for beginners: Getting started
Install Wireshark (Mac and Windows)
Wireshark is free to download and use on both Mac and Windows. On macOS, the installer may prompt you to add an additional capture component during setup. Before you start capturing, skim any installer notes or readme files you see.
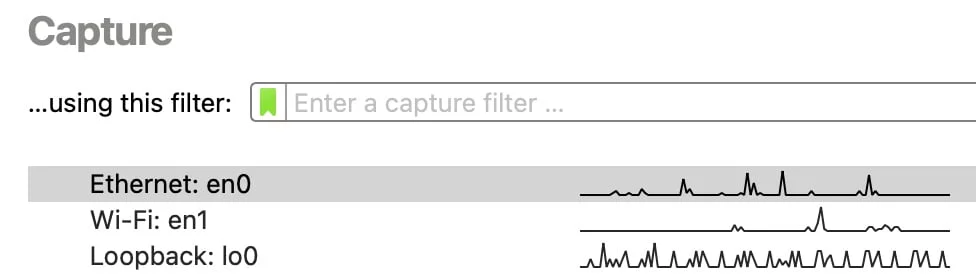
Pick the right interface (Ethernet vs Wi-Fi)
Next, choose which interface to capture from. Make sure the device you’re using is connected to the network you want to analyze.
For a clean beginner capture, Ethernet is usually the easiest. However, Wi-Fi often works great on Macs, while some Windows setups can require specific drivers or compatible hardware.
Capture packets in Wireshark (beginner method)
When you double-click an interface (like Ethernet), Wireshark starts capturing immediately. To make your PCAP useful, generate the exact traffic you want to troubleshoot while the capture runs.
- Start the capture on the interface you’re actively using.
- Immediately reproduce the issue (open a specific website, stream a video, sign in to an app, etc.).
- Let it run long enough to capture the behavior (often 15–60 seconds for simple tests).
- Click the red Stop button (top-left).
- Save the PCAP if it matters, or close without saving if it was just practice.
Wireshark tutorial for beginners: Analyze a PCAP without getting overwhelmed
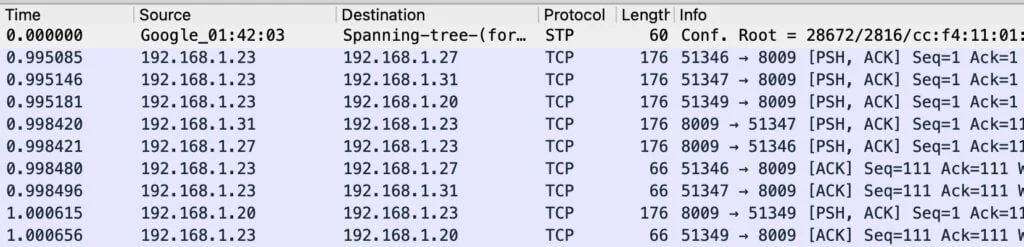
Understand packet rows (what you’re looking at)
Each row in Wireshark represents one packet. When your device loads a webpage, downloads a file, or syncs an app, it moves data across the network in packets.
Meanwhile, your capture will also include background noise (routers, smart devices, app updates, keep-alives). Because of that, filtering is the skill that makes Wireshark “click.”
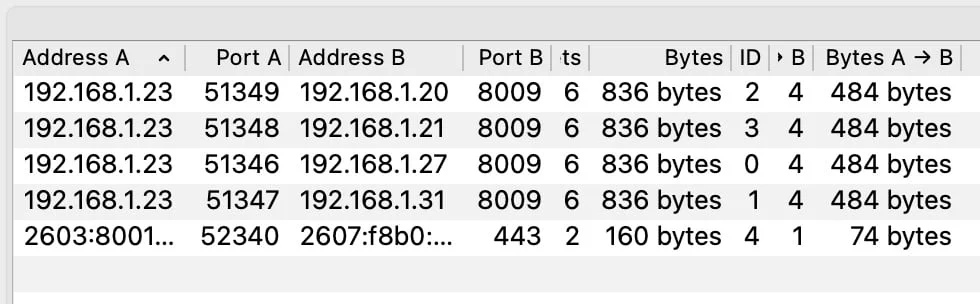
Bird’s-eye view: Statistics → Conversations
For most beginners, the best starting point is Statistics → Conversations. This view summarizes “who talked to who” in your PCAP, so you can spot big transfers, long-running sessions, and unknown endpoints faster.
- Address A ↔ Address B
- Packets sent in each direction
- Total bytes transferred
- Conversation duration
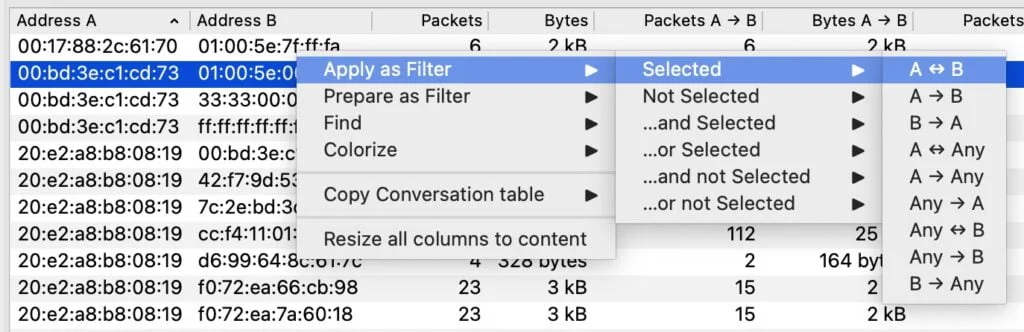
Right-click filtering (fastest way to drill down)
Next, right-click an IP address (in Conversations or in the packet list) and use Apply as Filter. This is the fastest way to focus on the traffic you actually care about—without memorizing display filter syntax.
Wireshark filters for beginners (the ones that matter)
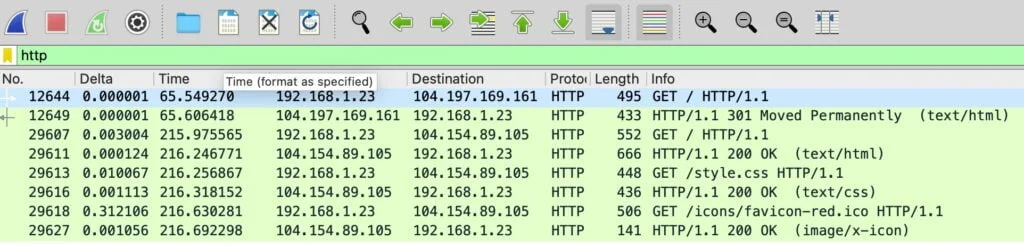
Filter 1: HTTP traffic (unencrypted)
Start with http. If the filter turns green, it’s valid. Then, use Follow Stream to see the full exchange for that specific flow.
- Display filter:
http - Next step: Right-click a packet → Follow → HTTP Stream
Filter 2: HTTPS traffic (TCP port 443)
Most secure web traffic uses TCP port 443. Although you usually can’t read the encrypted payload, you can still learn a lot from endpoints, timing, and patterns.
- Display filter:
tcp.port == 443

Quick note: In practice today, port 80 is typically HTTP and port 443 is typically HTTPS. That’s why “http” + Follow Stream can show readable data, while HTTPS focuses more on metadata and patterns.
Filter 3: Hide background protocol noise
To reduce clutter, remove common background protocols with:
!(arp or stp or lldp or cdp)
Filter 4: Find SYN packets (new TCP connections)
To highlight new connection attempts, use:
tcp.flags.syn == 1
Filter 5: Show Wireshark analysis flags
For a “show me the weird stuff” view, start with:
tcp.analysis.flags
Filter 6: Find TCP resets (RST packets)
If connections keep failing, check resets. This isn’t automatically “malware,” but it is often a useful troubleshooting clue:
tcp.flags.reset == 1
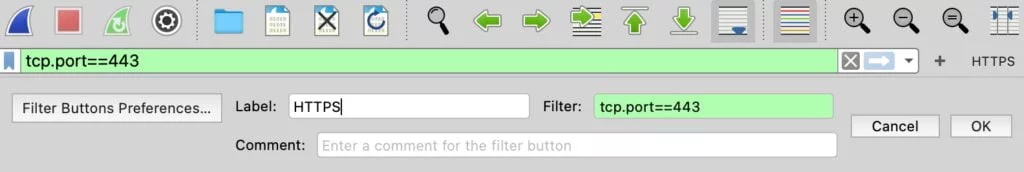
Wireshark beginner tip: Add custom filter buttons
To save time, create custom filter buttons for the filters you use repeatedly.
- Type a filter (example:
tcp.port == 443). - Click the + icon to the right of the filter toolbar.
- Name the button (example: HTTPS).
- Save it, then reuse it anytime.
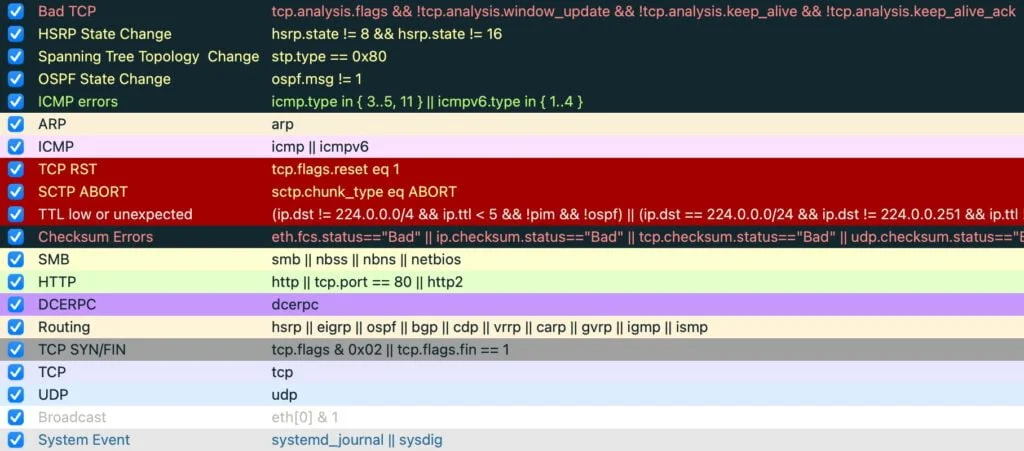
Wireshark coloring rules (what the colors mean)
Wireshark’s coloring rules act like a built-in visual hint system. For example, certain colors often correlate with retransmissions, resets, or other patterns Wireshark thinks you should inspect. Review them via View → Coloring Rules.
Follow Stream in Wireshark (see what was exchanged)
After you filter down to relevant packets, right-click one and choose Follow → TCP Stream (or HTTP Stream when applicable). This compiles the conversation for that flow, which makes it much easier to understand what happened.

Practical Wireshark training for beginners (safe PCAPs)
Practice with real PCAPs from Malware-Traffic-Analysis.net
If you want to improve fast, practice with known “real world” packet captures. This site provides PCAPs tied to specific incidents plus objectives, so you can investigate with structure and then compare your results to the provided analysis.
Tip: Start with Conversations, identify the main IPs involved, apply a filter, and then follow streams as needed.
Frequently Asked Questions
Yes—as long as you only capture traffic on networks and devices you own or have permission to analyze. Wireshark is a legitimate analysis tool, but packet captures can include sensitive information, so store PCAPs carefully.
A fast Wireshark tutorial for beginners workflow is: Statistics → Conversations for a bird’s-eye view, then right-click an IP and Apply as Filter (A to/from any) to drill down. After that, use Follow Stream to view full exchanges for specific flows.
Use the display filter “http” to surface HTTP traffic. Then right-click a packet and choose Follow → HTTP Stream to see what was exchanged in that stream (when applicable).
Most HTTPS traffic uses TCP port 443. Use the display filter “tcp.port == 443” to focus on that traffic. While the payload is encrypted, you can still learn a lot from connection patterns and endpoints.
Those are coloring rules. Wireshark highlights certain packet patterns it thinks may be worth investigating (retransmissions, resets, analysis flags, etc.). Review them in View → Coloring Rules.